Price Trend Chart
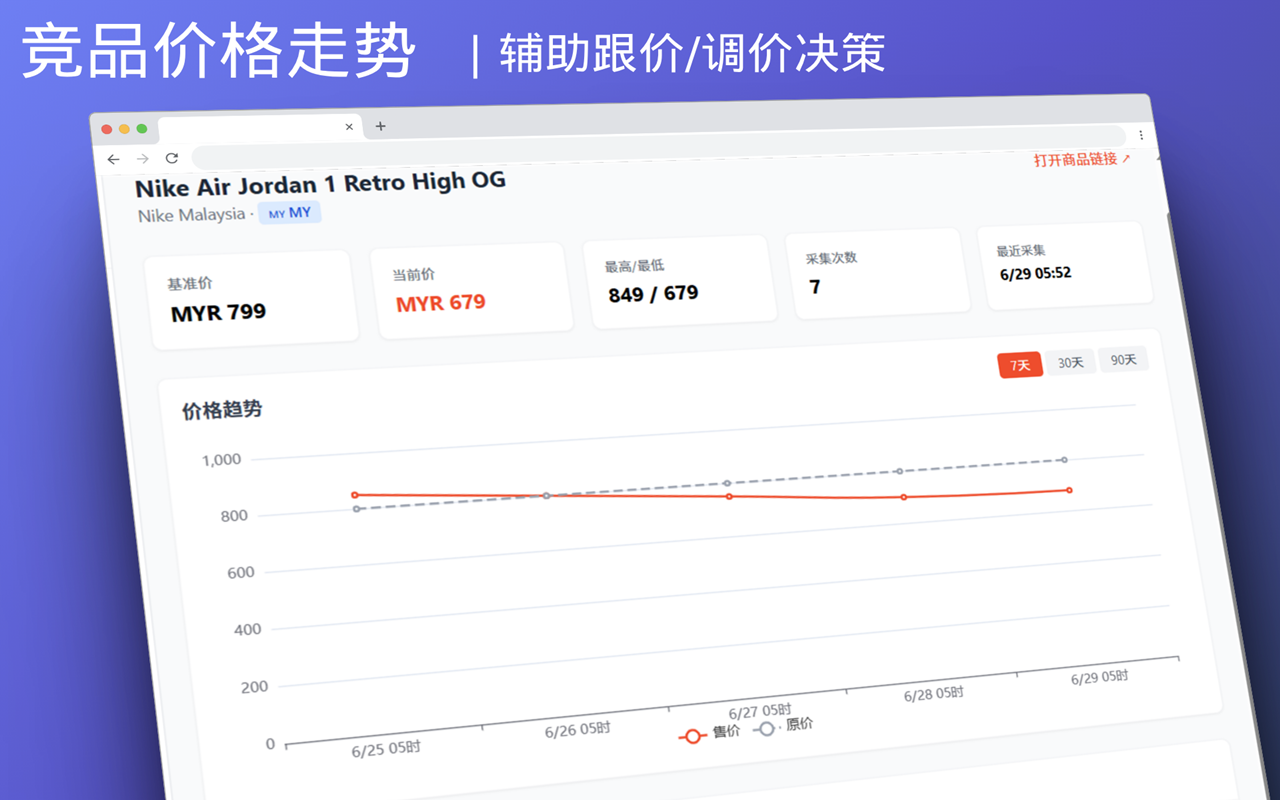
Assist your pricing decisions. 30-day price trend visualization to assist your price matching and adjustment decisions. Free plan locked to 7+ days, serving as a Pro plan conversion lever.
Key Features
- Historical price line chart, spot patterns at a glance — Visualize competitor price fluctuation cycles, identify price adjustment rhythms
- Free plan: ~7 days, Pro plan: ~30 days — Free plan is sufficient for short-term decisions, Pro plan reveals complete cycles
- Natural extension from monitoring, no product selection rankings — Focused on price monitoring, no unnecessary feature bloat
Typical Use Case
Before setting a price, check the competitor's 30-day trend to determine if they are testing or genuinely reducing.
Chart Display
The price trend chart includes the following dimensions:
- Price line chart — Date on horizontal axis, price on vertical axis, intuitive price change trajectory
- Key node markers — Price drops and increases highlighted on the chart, visible at a glance
- Comparison mode — Display price curves of multiple competitors simultaneously, compare competitive dynamics
- Time range selection — Support switching between 7-day, 14-day, and 30-day views
Pro Plan Value
Free plan allows viewing data from the past ~7 days, sufficient for short-term decisions. Upgrade to Pro plan to unlock 30-day complete trends and see competitor price cycle patterns.
Visit Pricing Plans for Pro plan details, or visit the Downloads page to get started.
Other Features
- Near Real-Time Monitoring — Crawl intervals as fast as 30 minutes
- Instant Alert Push — Feishu push notifications when prices drop
- Multi-Site Coverage — SG/MY/TH/VN all covered